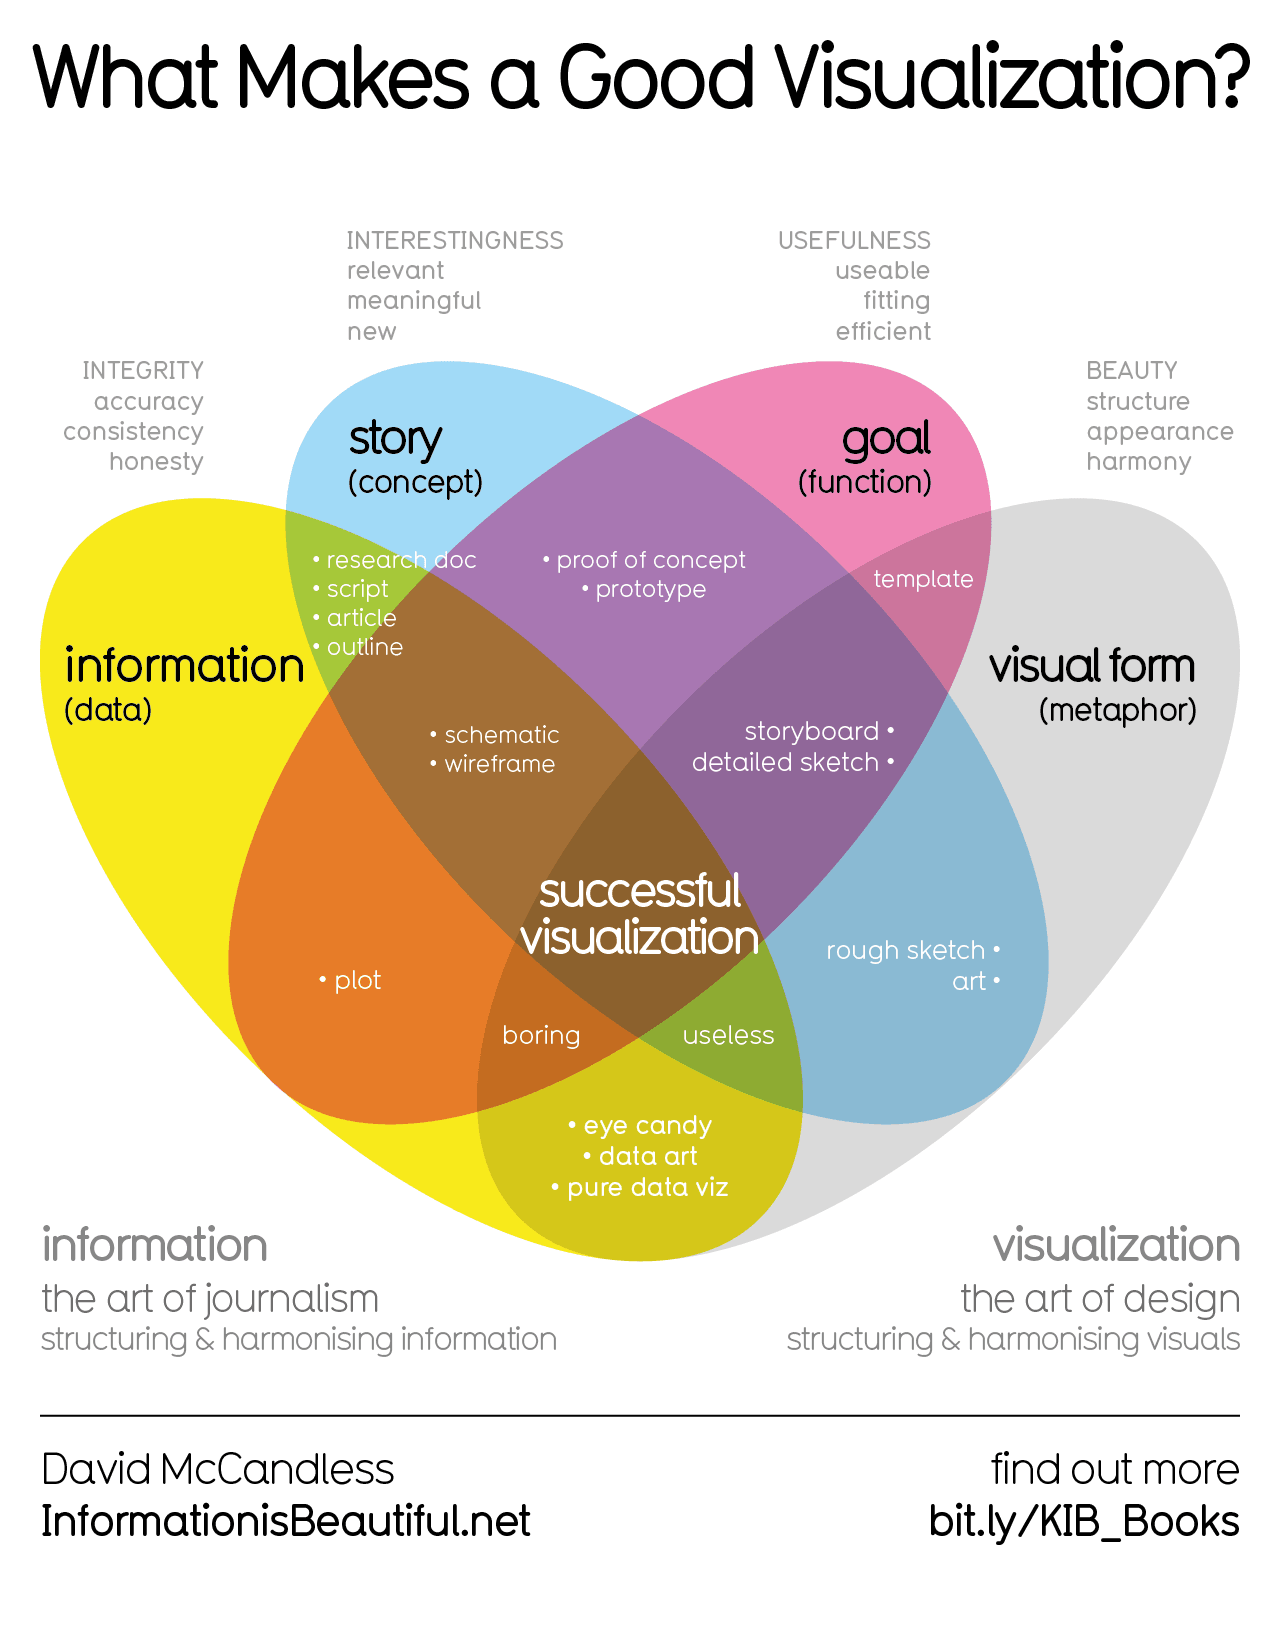


I mean… you’re not wrong… But still made me laugh out loud


Sounds like you just don’t like 100% stacked column charts. This is their primary use case after all. I can’t see how an XY plot would do a better job, wouldn’t there just end up being a ton of overlap, making it hard to discern the differences between the smaller segments? Do you have an example where you think an XY plot represented this type of data better?
Sleep’s one of the best free pleasures around. It’s free, it heals your body and mind, and just feels good.
I’ve fought a lot with insomnia in recent years and truly appreciate when I’m able to get a good night’s sleep. I’d rather have a bit shorter days, but feel much better due to being well rested whenever possible. How does sleeping make you feel guilty?


You go to settings -> filters & blocks


Why would a company care about a rented property losing value?


Nobody would qualify as CEO at any company I’ve worked for if those were the rules. I’d love to see someone try to estimate the exact value added by any single software developer working in a team